Price and volume are not enough
Charts show what already happened. They rarely show the options-driven environment that can shape the next reaction.
 MarketRegions
 Discover the hidden options structure behind the regions where markets tend to react, accelerate, or stabilize.
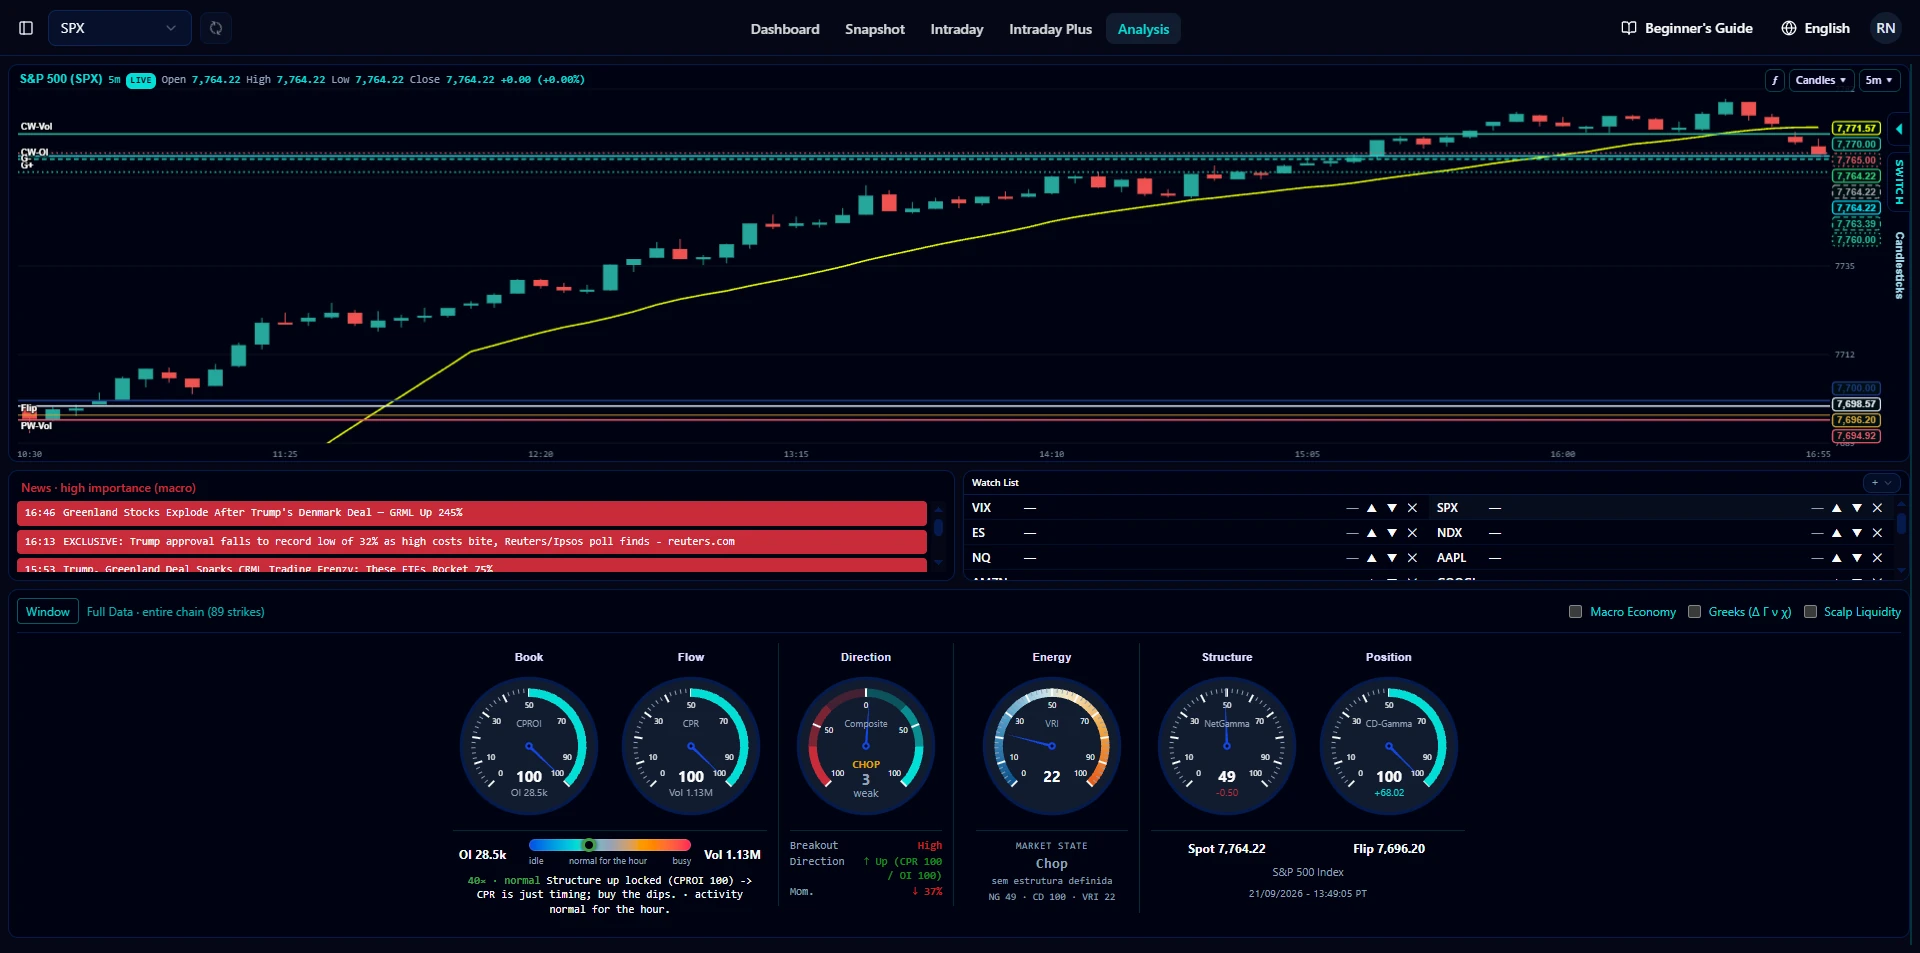
Charts show what already happened. They rarely show the options-driven environment that can shape the next reaction.
Without a view of Gamma, Delta, and related exposure, key levels can look arbitrary instead of structural.
More overlays rarely create clearer decisions — they often compete for attention without a shared map.
Reaction, acceleration, and consolidation zones stay scattered across tools instead of one visual platform.
MarketRegions brings positioning, liquidity, and proprietary metrics together so you can understand the environment in which price is moving — Problem → Product → Outcome.
Identify regions where the market may be more likely to react, accelerate, consolidate, or experience increased volatility.
Gamma, Delta, Vanna, Charm, Open Interest, Volume, liquidity, and proprietary metrics in one visual system.
Follow regions during real market hours and observe how price behaves around the structure the platform highlights.
Complete at least 80% of the free Market Structure Masterclass to unlock 15 days of full platform access.
From a glance at levels to the full Analysis map — the same session, four depths.
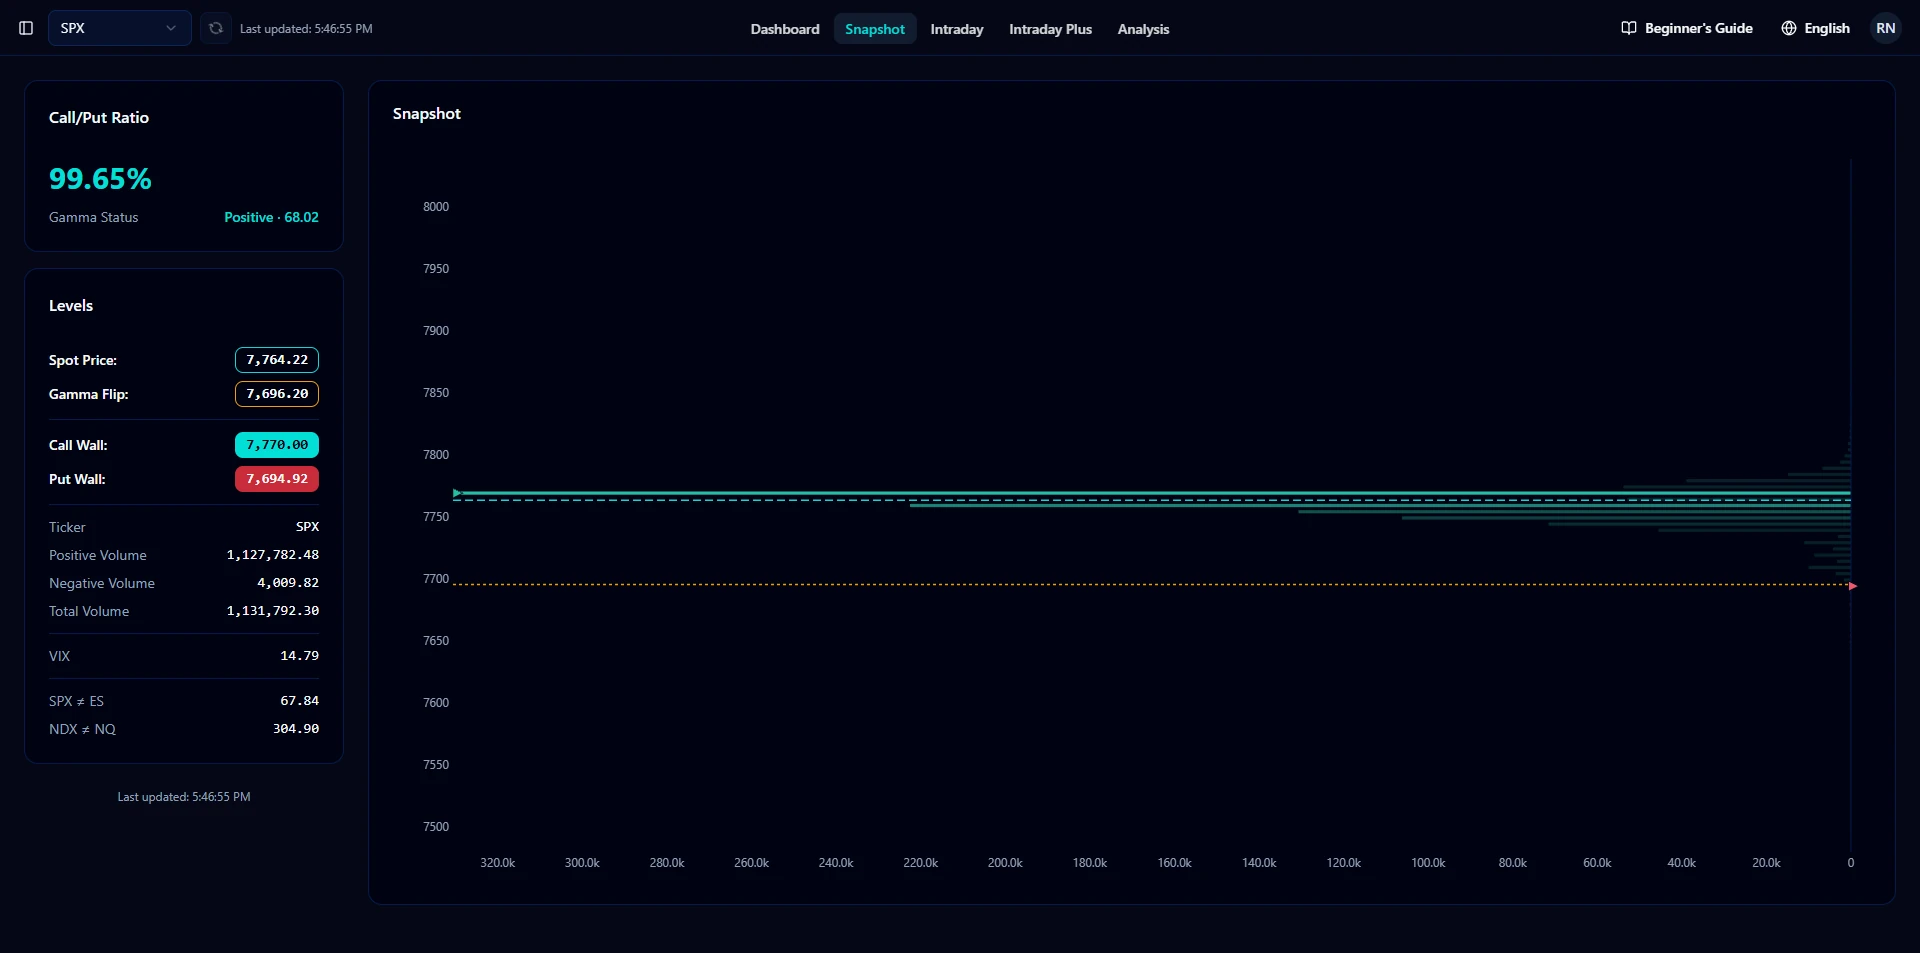
Spot, walls, flip, and volume context across major tickers at a glance.
Key Features
Snapshot
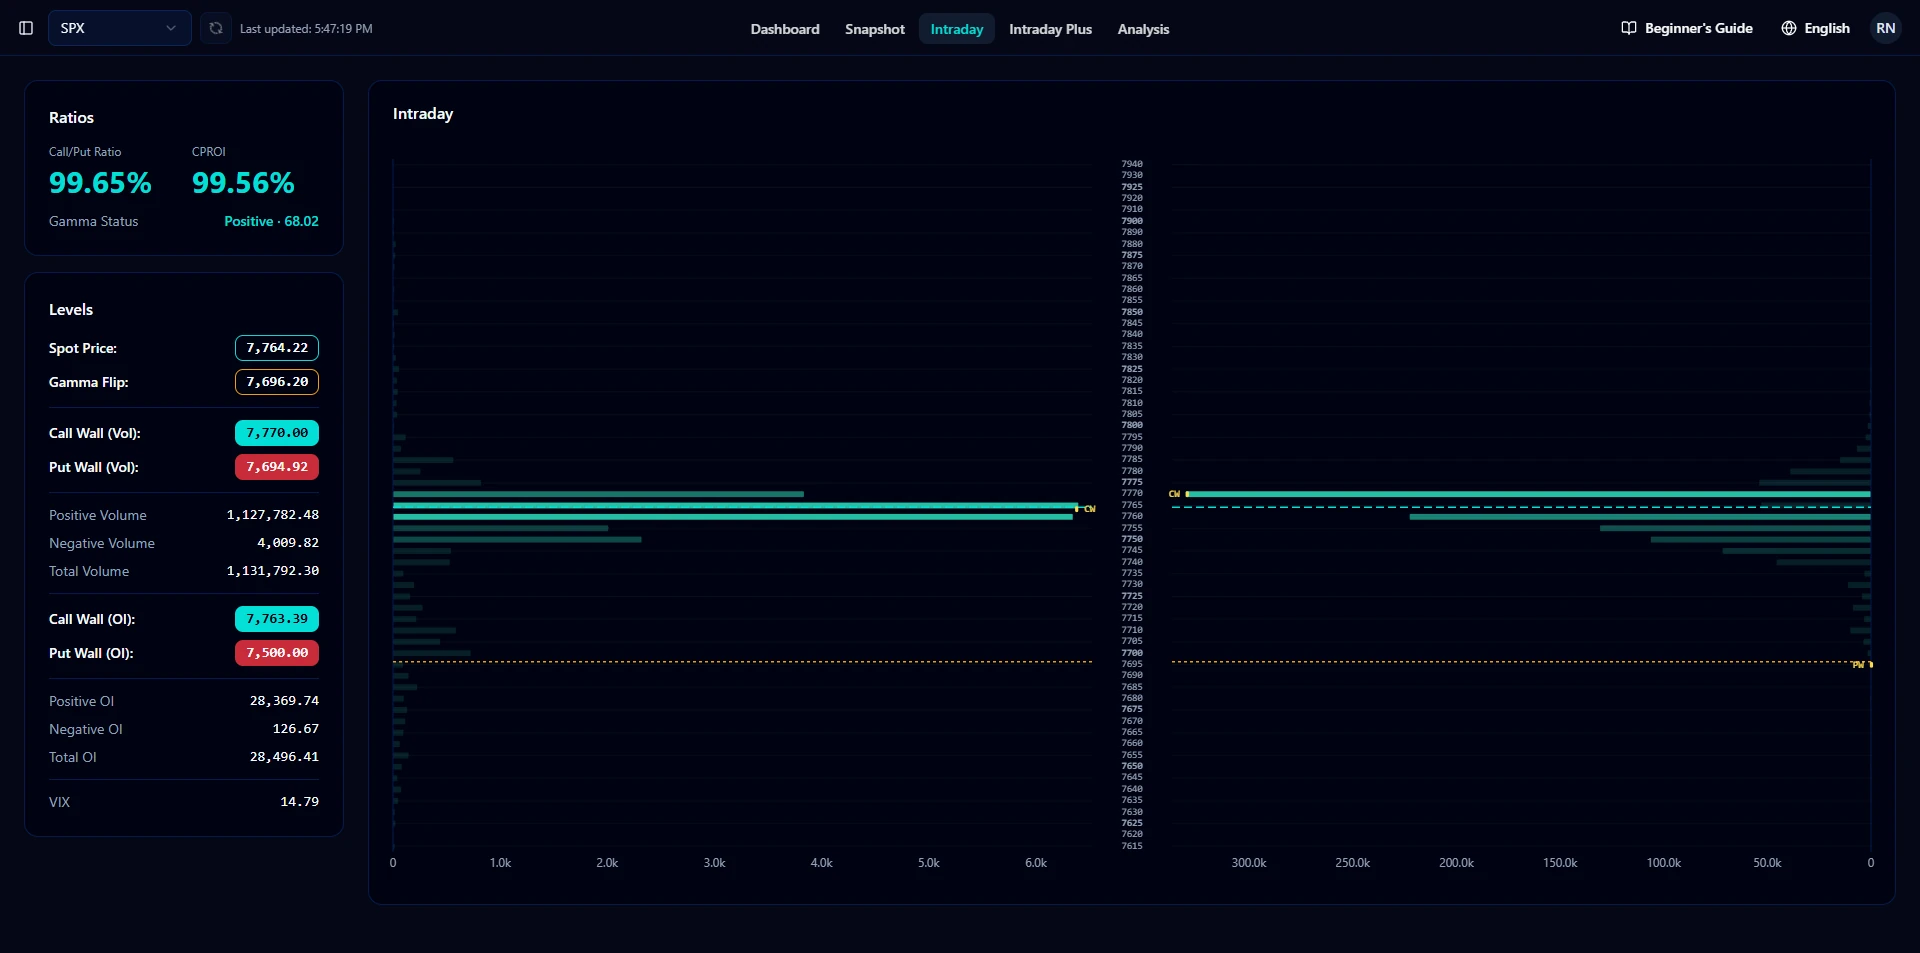
Track live session dynamics as spot, walls, and flip evolve through the day.
Key Features
Intraday
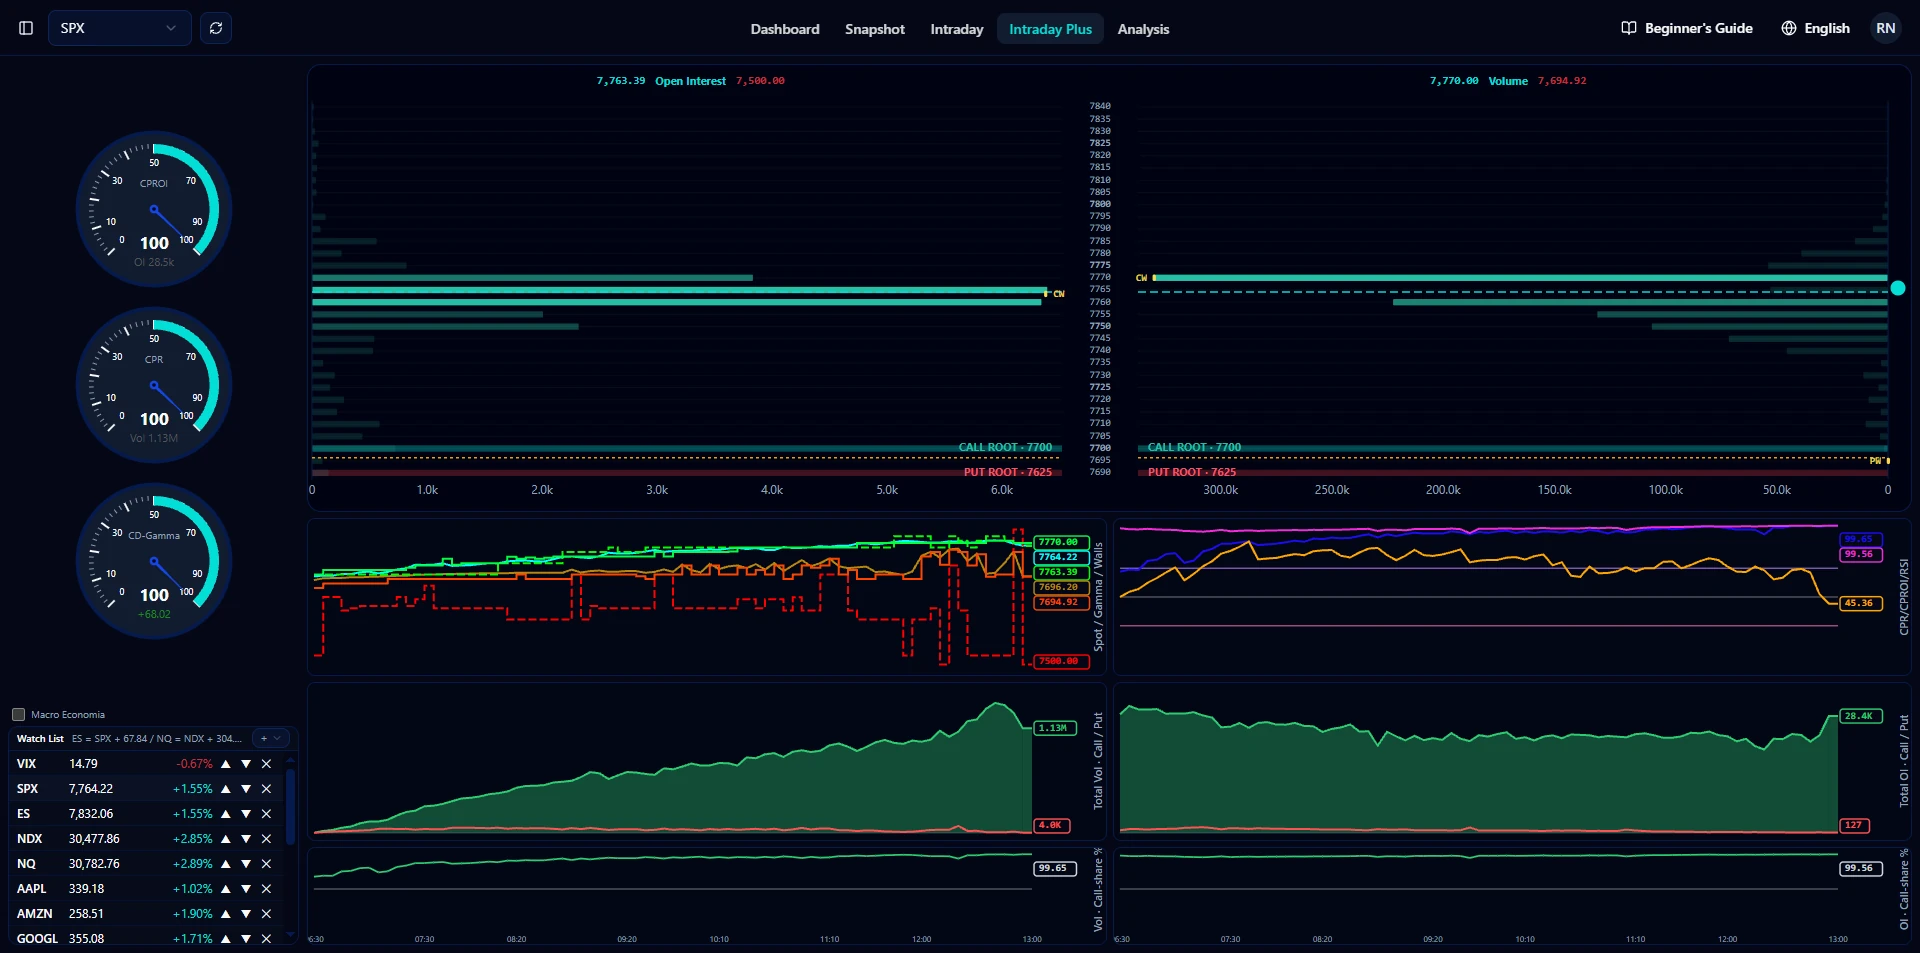
Go deeper with session history, watchlist metrics, and pre-open walls when the live map is not enough.
Key Features
Intraday Plus
Combine candles, GEX profiles, and overlays so structure and price share one view.
Key Features
Analysis
Macro, Greeks, Scalp Liquidity, and A.I Support sit beside the desks you work from.
Add broader context and educational briefings alongside options structure.
Align session tools with the wider backdrop.
See how Greek-driven structure supports the regions you watch on the main tools.
Connect exposure to the map you trade around.
Scan liquidity heatmaps and GEX regions built for short-horizon session work.
See where liquidity clusters as the session unfolds.
An educational reading of session structure so you can ask about the map without leaving the platform.
Context on demand — not a signal service.
Create your account and choose the tools that fit your process.
Load live structure, levels, and regions for the instruments you follow.
Use MarketRegions as an informational layer — not a signal service — alongside your own plan.
Coverage includes instruments traders already watch — such as SPX, ES, NDX, NQ, SPY, and QQQ. Content is educational and informational only. Review our Disclaimer, Privacy Policy, and Terms for full details.
Focused on the short-dated options environment where positioning can matter most.
Translate complex data into scannable market regions instead of another stack of lines.
Greeks, OI, volume, liquidity, and proprietary metrics share one visual language.
Analysis, intraday, snapshot, greeks, and more — without juggling disconnected apps.
Packages and on-demand tools are listed on the subscription page. You can compare tiers and manage billing after you create an account.
Complete at least 80% of the free Market Structure Masterclass to unlock 15 days of full access. The Masterclass video and unlock flow are rolling out; check back as content is published.
Create an account, sign in, and open the tools included in your plan. No desktop install is required for the web platform.
Yes. Manage or cancel subscriptions through the billing portal linked from your account.
Traders who want educational context on options-driven market structure — especially around ZERO DTE and related instruments.
No. MarketRegions is educational and informational only. It is not personalized investment advice or a recommendation to buy or sell any security.
See our Privacy Policy and Terms & Conditions for how account and usage data are handled.
Join MarketRegions and turn complex options data into clear visual regions you can follow during live sessions.
Informational tool only · Manage billing anytime · Educational use